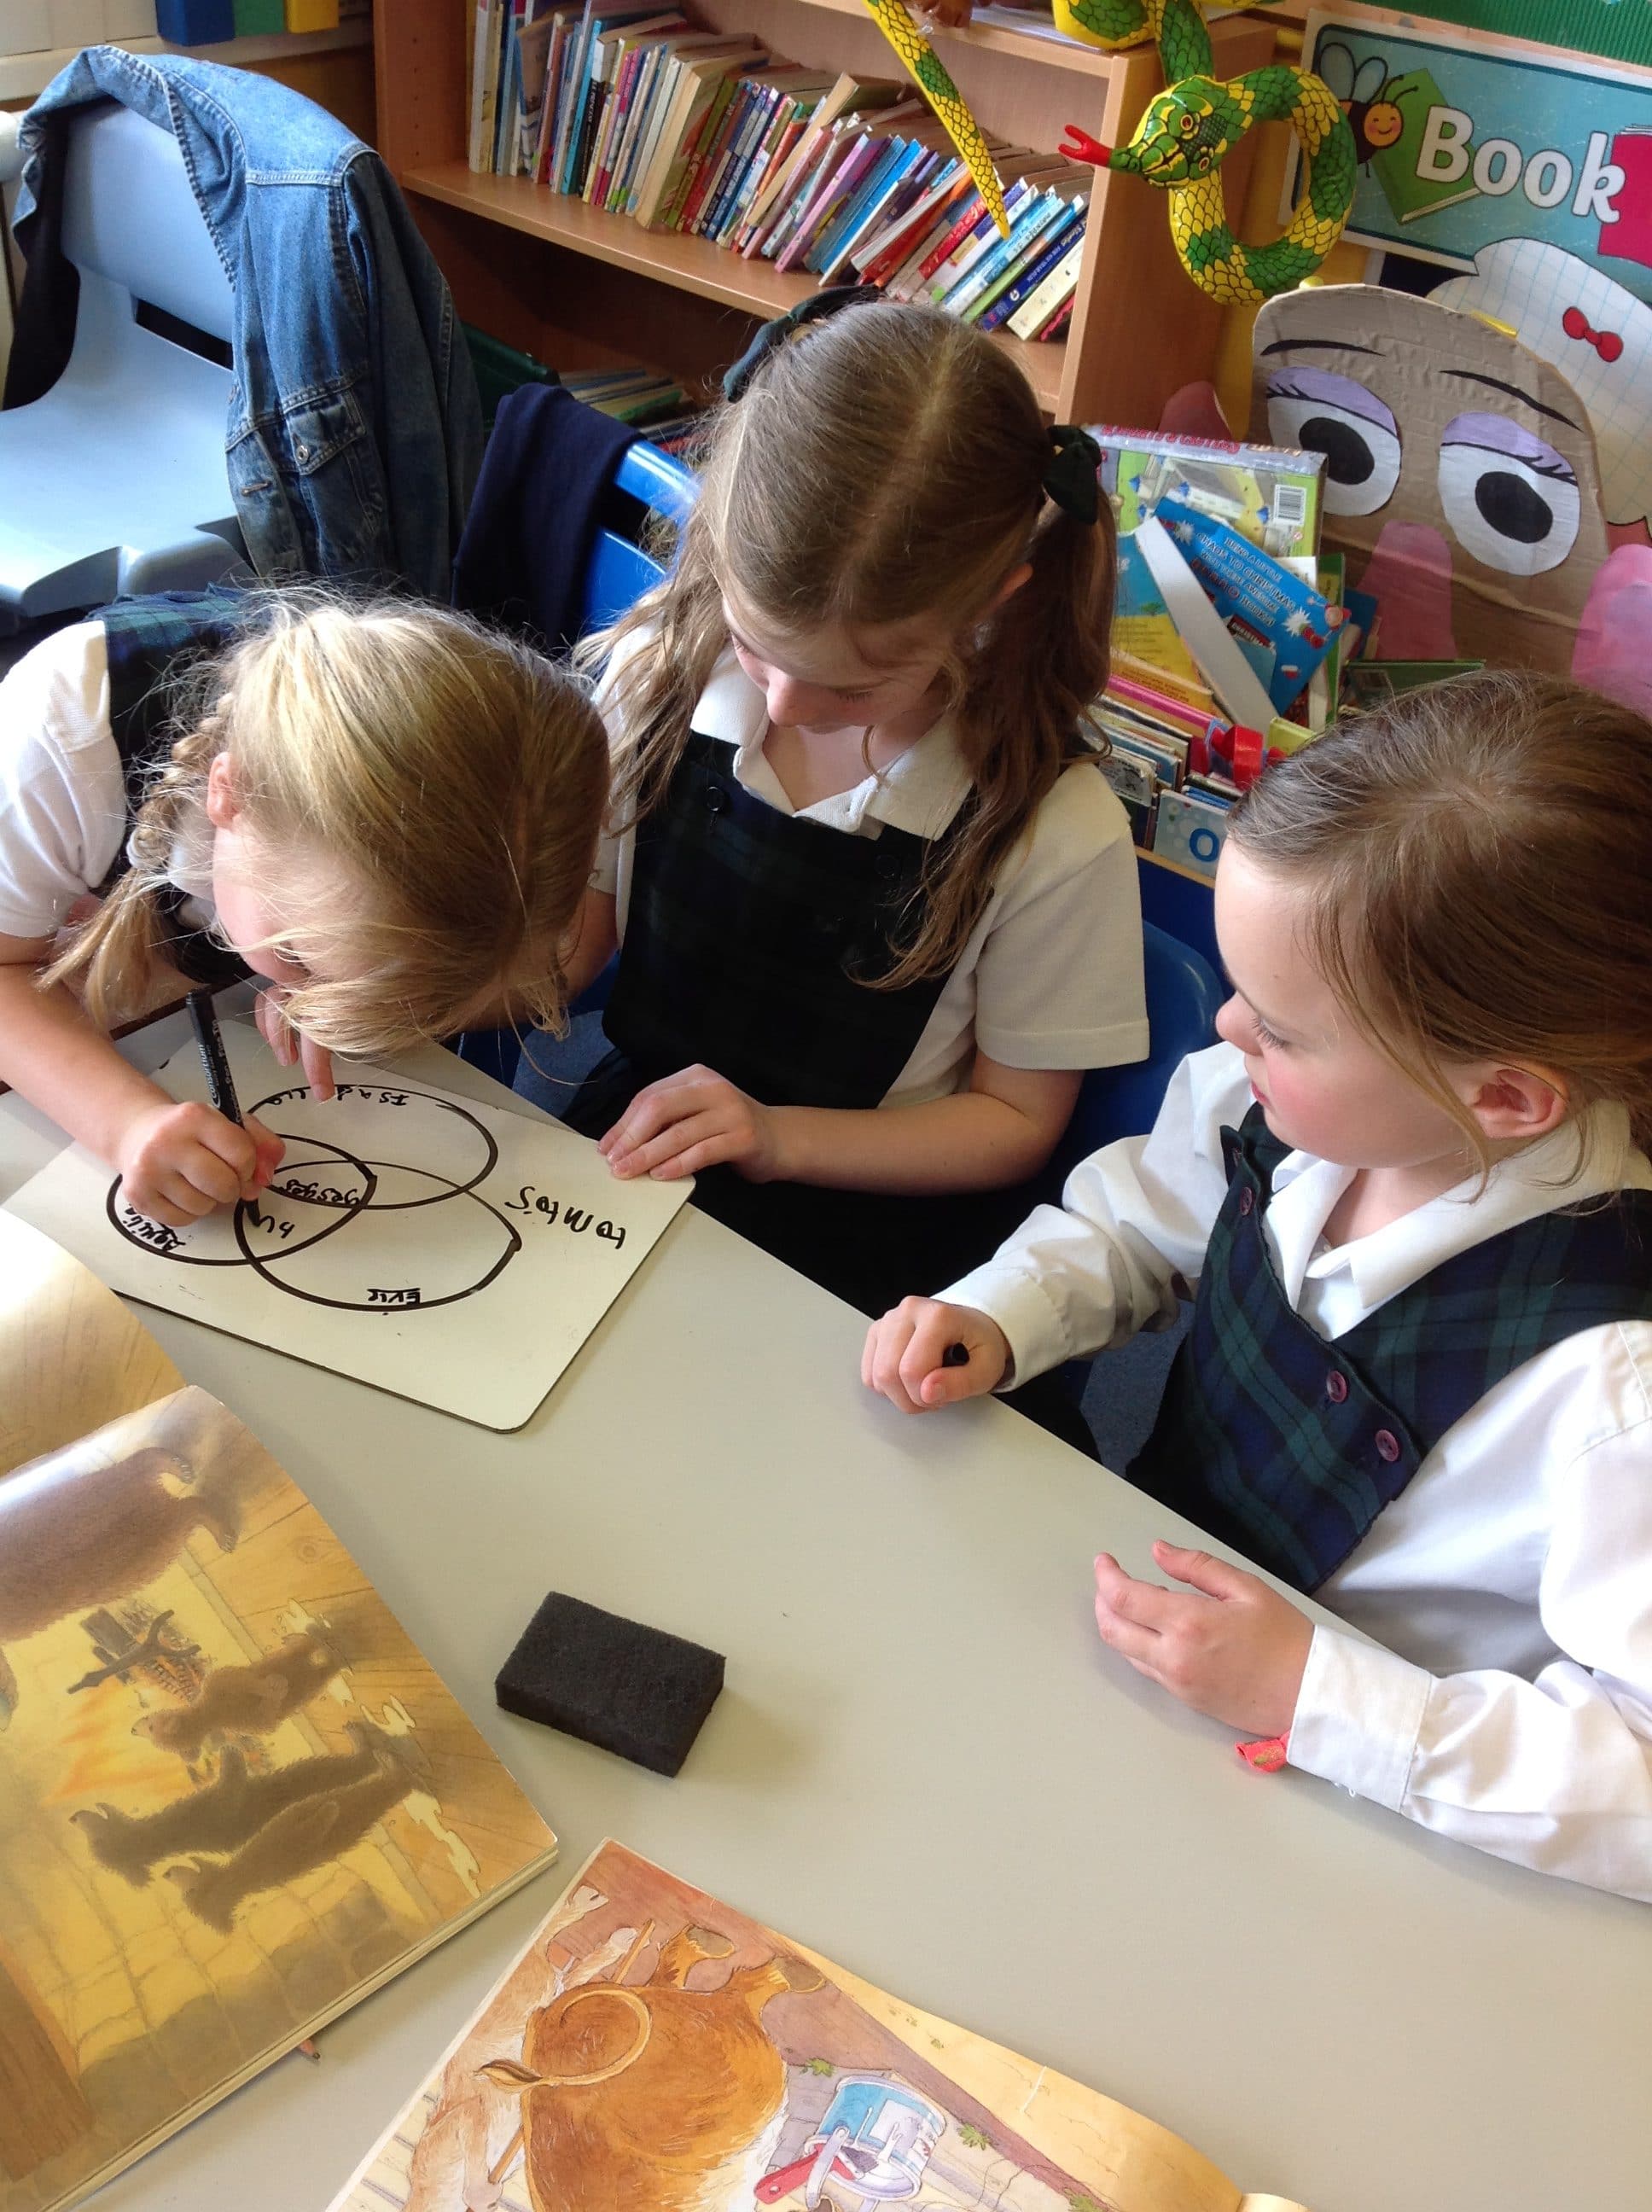
The Year 2 girls have been finding different ways of recording information. They have learned about Carroll Diagrams (named after the famous author, Lewis Carroll), tally charts and Venn Diagrams.
The girls really enjoyed finding out more about each other’s likes and dislikes before recording the information using Venn Diagrams. There were quite a few common dislikes such as mushrooms, onions and even white boards! Equally, it was also lovely to talk about our shared likes which included being kind, helping, sweets and The Maynard School!